Competitive intelligence for property portals

Your portal sees its own listings.
ProperBird shows you the rest.

Every night we read the portals and the agency websites of your market. Every morning your sales, account and leadership teams see what their own data cannot show: which agents publish where, and what never reached you.

Trusted by property portals and real estate investors worldwide

01The blind spot

Every portal misses part of its market. Even the leader.

We read the websites of the largest agencies in a market and compare what they publish with what each of the top portals carries. No portal has everything, and the gap is largest where you would least expect it.

up to 30%of the largest agencies' stock is missing from the best-covering portal of a market

On the weakest of the top three portals it is up to two thirds. Whoever relies on one portal sees a different market than the one the agencies publish.

1 in 2
large agencies keep their biggest portal inventory somewhere other than the market leader
thousands
of smaller agency websites behind the largest ones in every market, each with its own listings
Share of the largest agencies' own-site stock a portal does not carry
Market A7% best-covering portal65% weakest of the top threeMarket B18% best-covering portal36% weakest of the top threeMarket C30% best-covering portal31% weakest of the top threeMarket D17% best-covering portal30% weakest of the top threeMarket E10% best-covering portal28% weakest of the top threeMarket F2% best-covering portal14% weakest of the top threeMarket G5% best-covering portal14% weakest of the top three
Market A
7% best-covering portal
65% weakest of the top three
Market B
18% best-covering portal
36% weakest of the top three
Market C
30% best-covering portal
31% weakest of the top three
Market D
17% best-covering portal
30% weakest of the top three
Market E
10% best-covering portal
28% weakest of the top three
Market F
2% best-covering portal
14% weakest of the top three
Market G
5% best-covering portal
14% weakest of the top three

Markets anonymised. ProperBird research, presented at Property Portal Watch.

Why it matters

Listings bring traffic. Traffic brings money. Money brings listings.

A portal grows on one flywheel, and it starts with inventory: buyers and tenants go where the property is, and agents pay to be where the buyers are. Your own data shows your slice of that inventory. The rest of the market is where the flywheel is decided: the agents you have never called, the customers who are drifting, the suburbs where a competitor is quietly winning. ProperBird makes that part visible, every morning.

Hunt
the agents who already pay a competitor, and not you
Farm
the customers whose listings are drifting to a competitor
Price
the suburbs where you lead, and can charge for it
ListingsProperBird sees Trafficbuyers, tenants Moneypaying agents
02What you get

One market view, every morning.

ProperBird adds what your own data cannot see: every agent and every listing on competitor portals and on agency websites, matched to yours. One number for the whole market, and the names behind it.

Listings in your market, by where they are visible · illustration
12,30028,70014,6005,100+19,700 | +48%INVISIBLE TO YOU TODAY41,000ON YOUR PORTAL60,700IN YOUR MARKETOnly on your portal · 12,300your exclusive listings, a selling pointOn your portal and on competitors · 28,700where you compete on visibility and priceOn competitor portals only · +14,600agents who publish elsewhere, not with youOn agency websites only · +5,100listings that never reach a portal
41,000on your portal
60,700in your market
+19,700 +48% invisible to you today
  • Only on your portal 12,300your exclusive listings, a selling point
  • On your portal and on competitors 28,700where you compete on visibility and price
  • On competitor portals only +14,600agents who publish elsewhere, not with you
  • On agency websites only +5,100listings that never reach a portal
▦

Dashboard

Market share by suburb, hunt and farm lists, portal comparison and trends. For teams without a BI department.

▤

Monthly report

The same numbers as a PDF for the management meeting, every month, with the changes called out.

✦

Claude MCP New

Connect Claude to your ProperBird data and ask questions in plain language. Read-only, scoped to your subscription.

⌗

Raw data

Daily Parquet exports to your own S3, Google Cloud, Azure or NextCloud. API and database access on request.

The dashboard

Your market at 06:00.

One screen per question: where you lead, where you lose, who to call today.

Demo Portal · Sample CityDemo data
Listing share34%+1 pt vs last month
Agents on competitors only1,200hunt candidates
Customers at risk40drifting to a competitor
Website-only listings2,000on agency sites, on no portal
Listing share by suburb
Old Town59% your portal28% best competitorHillcrest49% your portal32% best competitorNorth Harbour41% your portal38% best competitorWestgate30% your portal44% best competitorMillbrook22% your portal51% best competitorRiverside11% your portal61% best competitor
Old Town
59% your portal
28% best competitor
Hillcrest
49% your portal
32% best competitor
North Harbour
41% your portal
38% best competitor
Westgate
30% your portal
44% best competitor
Millbrook
22% your portal
51% best competitor
Riverside
11% your portal
61% best competitor
Top hunt targets this week
Harbourline Estates90Meridian Living47Blue Door Realty37Oakfield & Partners32Westgate Homes26
Harbourline Estates
90
Meridian Living
47
Blue Door Realty
37
Oakfield & Partners
32
Westgate Homes
26
active listings on competitors, none with you
Demo with invented numbers, places and agencies. Your dashboard shows your market, your competitors and your suburbs.
Claude MCP

Ask your market a question.

Connect Claude to your ProperBird data through the ProperBird MCP. Your team asks in plain language and gets answers from the same deduplicated dataset that feeds your exports and dashboards.

  • No SQL, no export, no waiting for a report. The question is the query.
  • Every answer names its source and date. Numbers come from your data, not from the model's memory.
  • Read-only and scoped to your subscription. Your countries, your portals, your team.
Claude · ProperBird MCP connected
Which agencies in Riverside have more than 20 active listings on Portal A and none on our portal?

Seven agencies match. The three largest:

Harbourline Estates47 on Portal A31 on own website
Meridian Living29 on Portal A18 on own website
Oakfield & Partners23 on Portal A—

Together the seven hold 11% of Riverside's listings. Do you want the full list as a CSV, or the contact details from their agent profiles?

Source: ProperBird MCP · hunt list · data as of yesterday · 7 rows
Full list as CSV, and flag the ones that also publish on their own website.
03For your teams

The same data, a different question for each team.

For sales teams

Call the agents who already pay for portals. Just not yours.

  • Hunt list by suburb. Every agent active on a competitor portal with no listings on yours, with their volume per portal.
  • Agency websites. Agencies that publish on their own site and not on your portal: listings none of your users can find.
  • Fresh every morning. The list you work today reflects last night's market.
Hunt list · Riverside districtupdated 06:10 today
AgencyPortal APortal BOwn websiteYour portal
Harbourline Estates4712310
Meridian Living29—180
Oakfield & Partners239—0
Blue Door Realty—15220
Westgate Homes11690
124 agencies in this district publish elsewhere and not with you. Illustration with fictional data.
For account management

See churn weeks before it reaches your billing.

  • Drift alerts. Customers whose listings shrink on your portal while they grow on a competitor.
  • Per-agent activity across every portal. Total, active, new and premium-placed listings.
  • Share of wallet. Where each customer's listings go, month by month.
Account watch · last 12 weeks3 of 212 customers
Castello Immobili At risk
Your portal 52 → 31Portal A 8 → 38
Nordlicht Immobilien Stable
Your portal 40 → 41Portal A 10 → 9
Blue Door Realty Growing with you
Your portal 18 → 44Portal A 26 → 10
Illustration with fictional data.
For leadership

Know where you are strong, suburb by suburb.

  • Market share per suburb. Your share of agents and listings against each competitor, at the level where sales teams work.
  • A priority map. Fortresses to price, win-backs to acquire, growth areas to promote.
  • Blind spots. The share of your market's listings your portal does not carry, on competitor portals and on agency websites.
Suburb priorities · 2026 Q348 suburbs
Win-backFortress SeedAudience growth Old Town Hillcrest Riverside Millbrook North Harbour Eastfield Greenpark Westgate Your share of listings (ProperBird) → Brand strength (your data) →
Riverside: strong brand, 11% listing share. Win-back: 124 agencies to acquire. Illustration with fictional data.
For data and analytics teams

One clean dataset, delivered the way you work.

  • Daily Parquet exports to your own S3, Google Cloud, Azure or NextCloud. API and database access on request.
  • One schema, one identity. Every listing and every agent normalised across portals and deduplicated, with a cross-portal ID you can join on.
  • Delivery you can check. Every portal, every day: complete, on time, correct.
Delivery · yesterday's crawls3://your-bucket/properbird/
  • Portal A · listings41,208 rows05:42
  • Portal A · agents2,917 rows05:44
  • Portal B · listings27,551 rows05:51
  • Agency websites · 52 sites6,340 rows06:03
  • Matching · cross-portal IDs68,759 rows06:08
-- listings, one row per listing and day
listing_id   portal   agent_id   suburb     price    area_m2
first_seen   last_seen   premium   unique_listing_id  -- same flat across portals
Illustration with fictional data.
04How it works

Four steps, every night.

Portals are most static at night, so that is when we read them. By the time your team arrives, yesterday's market is on the screen.

  1. 21:00crawl starts200+ portals, agency sites
  2. 02:00normaliseone schema for every portal
  3. 04:00deduplicateone identity per listing and agent
  4. 06:00deliveredbucket, dashboard, Claude
21:00crawl starts200+ portals, agency sites 02:00normaliseone schema for every portal 04:00deduplicateone identity per listing and agent 06:00deliveredbucket, dashboard, Claude
01 · Collect
Every night we read the public listing and agent pages of 200+ portals and the agency websites in your market. We absorb the blocks, captchas and redesigns, so you never have to.
02 · Normalise
Every portal describes a flat differently. We map them to one schema: one property type, one price, one unit of area, one agency name, one suburb.
03 · Deduplicate
The same flat and the same agent appear on several portals. We link them to one identity, with photo comparison when the text disagrees.
04 · Deliver
By the morning the data is in your bucket, your dashboard and your Claude. Every delivery is checked: complete, on time, correct.
FreshObserved tonight, delivered tomorrow morning.
CompleteEvery portal you subscribe to, every day. A missing file is an incident, not a footnote.
DeduplicatedOne identity per agent and per listing, across all portals.
ConsistentOne schema, so a filter gives the same answer on every portal.
Agency websites

The listings that never reach a portal, read at the source.

Behind the largest agencies of a market sit thousands of smaller agency websites. We read them at scale, deduplicate them against the portals, and tell you which listings and which agencies are missing from yours, before your competitors see them.

6 days
median head start of the agency website where agencies publish on their own site first
1 week
until most of those listings reach a portal. Until then, only the website has them.
Site-first listings that had reached a portal, cumulative
within 2 days20%within 3 days30%within 7 days60%within 14 days85%
within 2 days
20%
within 3 days
30%
within 7 days
60%
within 14 days
85%

Listings that appeared on an agency website before any portal, one market, 2026. ProperBird agency-website crawls.

05Why ProperBird

Independent, careful, checked.

Independent

Founder-owned, part of no portal and no network. Each client's delivery, questions and dashboards stay with that client.

Public data, handled with care

We collect only what portals and agencies publish.

Every delivery is checked

Completeness, timing and content are monitored for every portal and every day, before you see the data.

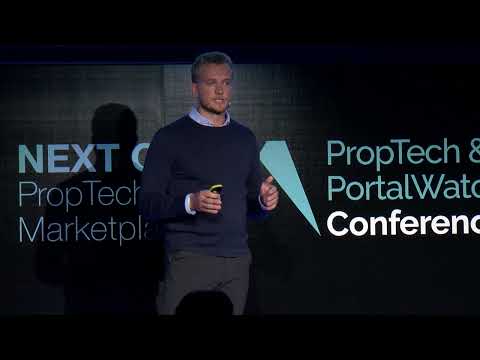
On stage

On stage at every Property Portal Watch conference of the past four years.

We present our research at the industry's conference and talk about it with PropTech analyst Simon Baker. The numbers on this page are ours, measured on the agencies' own websites, and we show the method with every figure.

Let's look at your market together.

Thirty minutes, your country, your competitors. We show you what the data says before you decide anything.